
A Gantt Chart for Your Projects
A Gantt chart to visualise your phases and deadlines, share the schedule and manage your projects.
No credit card required

An intuitive Gantt chart for a shared view of your project timeline
In Otilus, phases and deadlines are defined within each project card. The Gantt chart uses this information to automatically display the actual project schedule without requiring multiple entries.
- A Gantt chart generated automatically
Otilus’s Gantt chart is generated from the start and end dates of the phases recorded in each card. The schedule therefore remains consistent with project progress, without duplicate data entry. - An immediate view of critical periods
The Gantt chart highlights overlaps, delays and periods of intense activity. You can quickly identify projects that may slow down and the phases that require attention. - A clear and shared overview
The Gantt chart becomes a shared reference point for the team and can also be shared with clients.
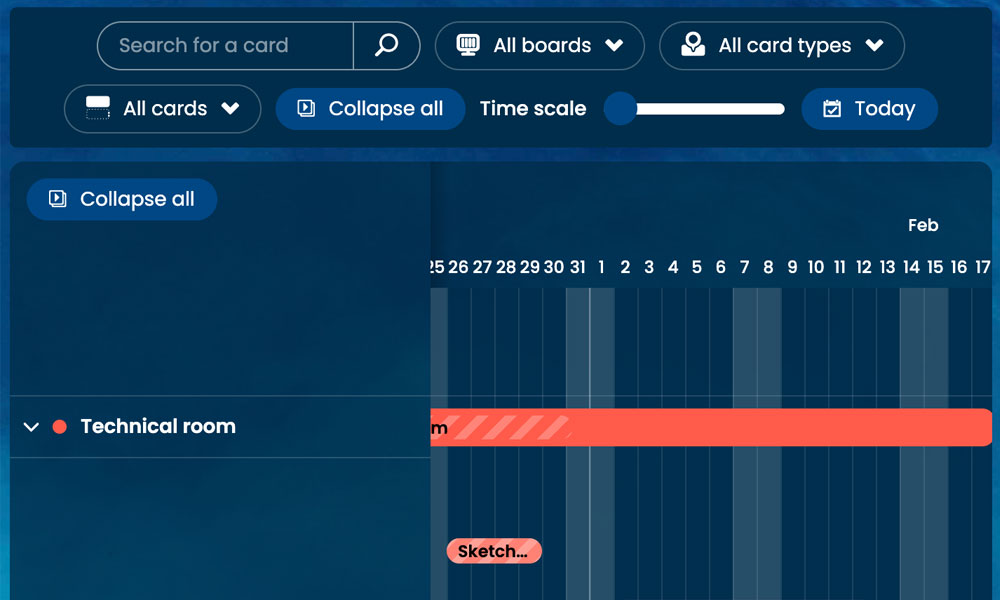
Visualize your projects over time
Display your projects and deadlines on a Gantt chart to better anticipate workloads and keep track of your schedule.
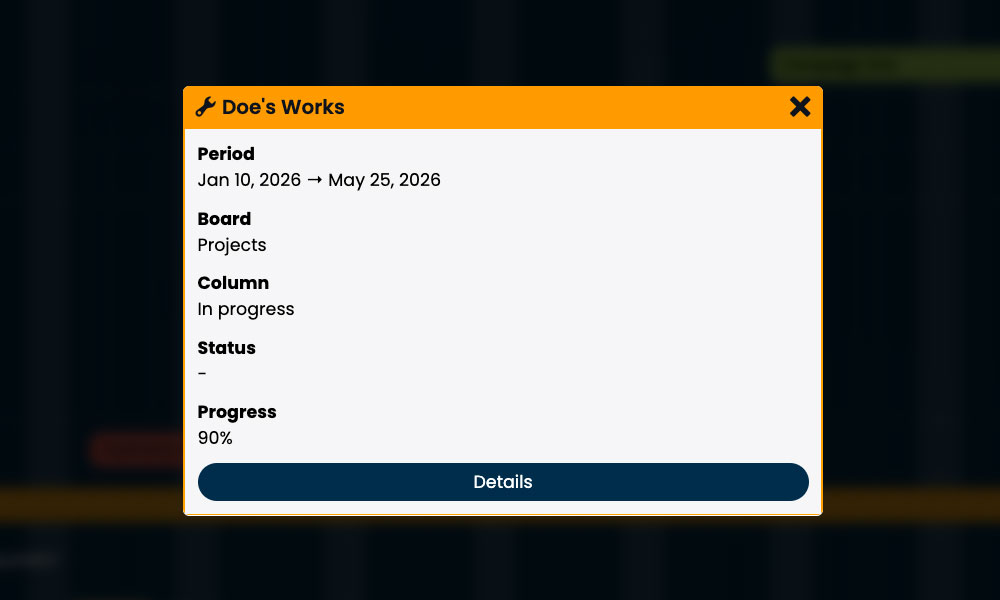
Track each project precisely
View dates, the current phase, and progress percentage directly from your Gantt chart.
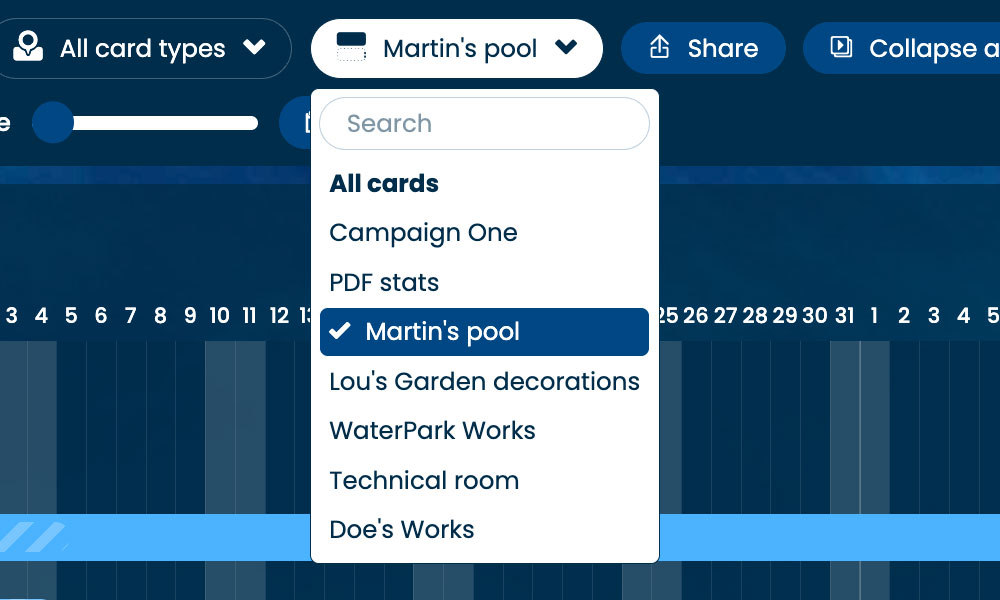
Filter your schedule
Display only the boards, card types, or projects that matter to you for a Gantt view tailored to your needs.
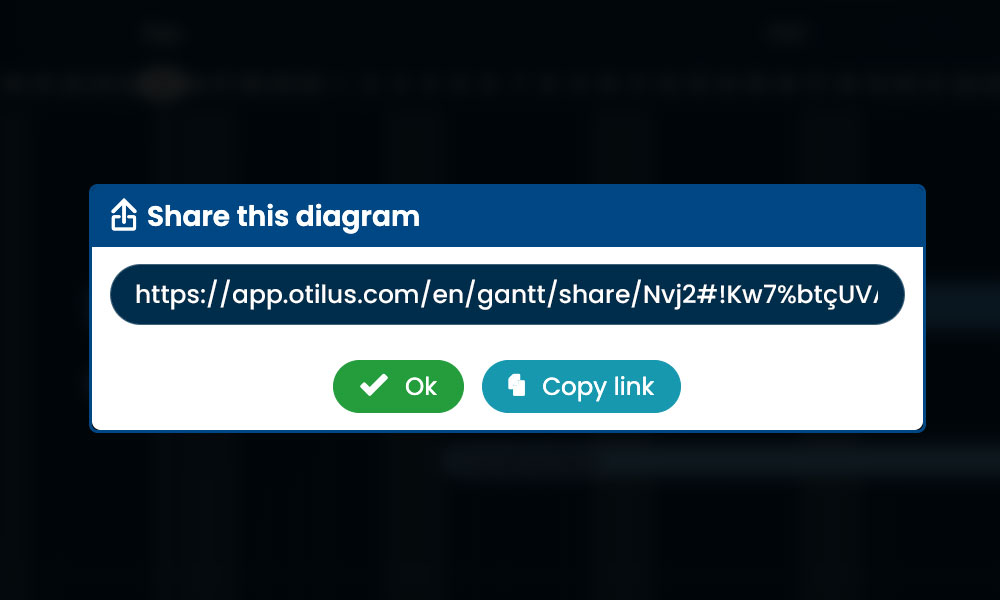
Share your Gantt chart easily
Generate a sharing link to send your schedule to a client or partner without giving them access to your Otilus workspace.
Tools that connect work with the project schedule
Project-related stress does not come solely from meeting deadlines, but also from the constant effort required to monitor and adjust them. Otilus makes project schedules easier to understand and share:
- Calendar synchronisation adds your phase deadlines to your usual calendars, with no duplicate entry or risk of forgetting them.
- Gantt chart sharing gives your clients a controlled view of the schedule without revealing your internal organisation.
- Notifications highlight upcoming deadlines and the moments when action is required.


Scenarios that automatically coordinate tasks
In Otilus, projects also move forward through automated scenarios. Depending on the type of card and the phase it reaches, tasks can be created and assigned automatically in line with the project schedule.
Kanban no longer simply represents progress: it helps coordinate work over time, in connection with the phases displayed in the Gantt chart.
From 1950s Kanban to time-based project management
Developed in Japan in the 1950s to visualise and streamline industrial workflows, Kanban became a major work management method without providing, on its own, a complete chronological overview.
By connecting it with phases, deadlines and the Gantt chart, Otilus places project progress within a clear timeline.
GTD and the Eisenhower matrix at the heart of Otilus project management
Inspired by the GTD method and the Eisenhower matrix, Otilus places each task within its context according to its level of urgency and importance, as well as the project’s actual schedule.
Prioritising, delegating, planning or postponing become more natural decisions. These methods are built into the interface and keep actions aligned with the phases displayed in the Gantt chart.
Visualise your projects over time with a clear, shared Gantt chart
Automatically generate your Gantt chart from your project phases,
anticipate deadlines and share a readable schedule with your team and clients.
No credit card required